KARA partners with colleges for deep dives into America’s child abuse and child protection issues. This in-depth report delivered by the students of Northeastern University demonstrates that the child welfare crisis Is worse than reported numbers say: What the next decade of child welfare looks like. For a deeper dive into their research click here.
This is information your State Representative needs to know
to make better policy for at risk children and families in your community.
Share this post with them now (find your Representative here).
Child welfare data in the United States tells a troubling story: risk is concentrated, the youngest children bear the greatest burden, and poverty is a powerful driver of harm. But a deeper look at how that data is collected, classified, and reported suggests something even more unsettling — the real situation is likely worse than the official numbers show.

Five graduate student teams recently partnered with Kids At Risk Action (KARA) to analyze federal and state child welfare data using modern analytics and machine learning. Their results, combined with watchdog work from Safe Passage for Children of Minnesota and national research on undercounted deaths, point toward a future in which child welfare harm may be both predictable and systematically underreported.
What the new analyses found
Across five student team projects, several themes were remarkably consistent.
- Risk is geographically concentrated. A small group of states — especially in the South and Appalachia — repeatedly showed high victimization and fatality rates even after adjusting for population size. Within states, a handful of counties often accounted for a disproportionate share of abuse and neglect.
- The youngest children are hit hardest. Under‑5s, particularly infants and toddlers, consistently made up the largest share of victims and were heavily overrepresented among deaths. When students examined death‑certificate data, they found that ambiguous “Could Not Determine” classifications were concentrated among infants, suggesting that many suspicious deaths never get cleanly counted as maltreatment.
- Neglect dominates — and tracks poverty. National data showed neglect making up roughly two‑thirds of all child abuse, far outpacing physical and sexual abuse. Independent analyses all pointed to poverty and low income as the strongest structural predictors of child welfare burden, especially in certain regions.
- Administrative data can predict risk. One team using a national child‑level dataset trained a machine‑learning model that predicted whether a CPS report would be substantiated with AUC around 0.82 — strong performance for real‑world decision support. Others used time‑series and ensemble models to forecast county‑level caseloads and short‑term fatalities, often finding that simple “last year predicts this year” baselines performed surprisingly well because patterns are so persistent over time.
- Prior system contact is a loud alarm bell. Across models, prior victim history, multiple maltreatment types in the same report, and caregiver risk factors like substance use and domestic violence were consistently among the strongest predictors of danger.
If the story ended there, we could say: “The system has serious problems, but at least we know roughly how big they are.” Unfortunately, that’s not true.
The Minnesota Family Assessment problem: when “helpful” responses hide harm
Safe Passage for Children of Minnesota has spent years examining how the state’s child protection practices affect what shows up in the data. The center of their critique is Minnesota’s heavy reliance on Family Assessment, a non‑adversarial response that emphasizes services and future safety rather than determining whether maltreatment happened.
In theory, Family Assessment is meant for lower‑risk cases. In practice, Safe Passage reports that Minnesota has used it far more widely than originally intended — moving as many as three‑quarters of reports into a track that often does not produce a formal finding, victim identification, or perpetrator record. Their review of child fatalities found repeated examples where high‑risk cases, including those involving very young children, were assigned to Family Assessment instead of full investigation.
This has three big implications for any forward‑looking analysis:
- Lower substantiation ≠ lower harm. If a large share of cases never go through a process that produces a “substantiated” or “unsubstantiated” finding, substantiation rates can fall even while danger remains the same or gets worse.
- Trendlines can mislead. When policy shifts more cases into Family Assessment, downward trends in substantiation or recurrence can reflect paperwork changes, not safer children.
- “Best practice” labels may be premature. Some quantitative work shows Minnesota well below national averages on certain administrative metrics, and one of the student teams initially highlighted the state as a best‑practice model. Safe Passage’s findings suggest those numbers must be read alongside evidence that many high‑risk cases were diverted away from fact‑finding.
In other words, Minnesota illustrates how a well‑intentioned “family friendly” approach can unintentionally erase maltreatment from the official record, especially when applied too broadly or to very high‑risk cases.
National nontransparency: a “jumble of standards”
The transparency problem extends beyond one state.
Casey Family Programs and others have documented serious inconsistencies in how states count child maltreatment fatalities. Reporting to the national NCANDS system is voluntary; nearly half of states submit fatality information only for children already known to CPS; definitions vary; and some states do not include deaths that occur outside prior agency involvement.
Research going back more than a decade has shown that death certificates miss a large share of abuse and neglect fatalities. One capture‑recapture study estimated that more than 60 percent of child abuse deaths may not be coded as such in vital statistics, especially for neglect and younger children. The Group 3 finding that “Could Not Determine” manner‑of‑death classifications are heavily concentrated among infants fits this pattern.
Taken together, this means:
- Official fatality counts should be treated as a floor, not a ceiling, especially for neglect and infant deaths.
- State‑by‑state comparisons are skewed by different definitions, reporting practices, and thresholds for linking CPS and vital records.
- National trend lines partially reflect changes in classification, review practices, and data‑sharing — not just underlying harm.
Underreporting, misreporting, and what projections really show
The student teams that built forecasts and predictive models did careful, rigorous work with the data available. But in light of underreporting, misclassification, and nontransparency, those models should be interpreted as projections of officially captured child welfare harm — not the full future burden of maltreatment.
Looking ahead, a more realistic reading of these projections would acknowledge at least four distortions:
- Hidden fatalities. As long as death‑certificate coding and state reporting practices undercount maltreatment deaths, forecasts based on those series will understate true lethal harm, particularly for neglect and infants.
- Family Assessment and similar tracks. Systems that rely heavily on non‑investigative responses may show declining substantiation and recurrence on paper while leaving a large pool of uncounted, unresolved risk.
- Inconsistent standards across states. States can look “better” or “worse” on national dashboards simply because they classify, review, or disclose cases differently, not because children are safer.
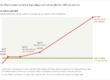
- Economic recovery is not enough. One longitudinal analysis found that child fatalities rose by about 30 percent from 2010 to 2023 even as unemployment fell by 61 percent, indicating that deeper structural issues — like housing instability, substance abuse, and weak prevention systems — are driving harm.
If nothing changes in how we count and classify maltreatment, the most likely scenario is that official data will continue to underestimate the number of children harmed and killed, even as advanced analytics make it easier to see patterns within that incomplete picture.
A better path forward: transparency as prevention
The good news is that the same tools used in these student projects can help build a more honest and effective child protection system — if paired with transparency reforms.
Here are some concrete steps that emerge from this combined work:
- Tighten and limit Family Assessment. Use it narrowly for genuinely low‑risk cases, set clear exclusions (for example, for children under age 3 or chronic, high‑risk patterns), and require a documented safety decision and minimal fact‑finding even when no formal maltreatment finding is made.
- Standardize fatality reporting. Adopt common national definitions for maltreatment fatalities, require states to report deaths for children (podcast) not previously known to CPS, and expand high‑quality child death review processes.
- Integrate data systems. Link CPS, health, law enforcement, and vital records to reduce undercounting and support more accurate forecasting.
- Publish more — and cleaner — data. Make state and county‑level indicators (including Family Assessment volumes, re‑reports, and near‑fatalities) public in a timely, usable form so advocates can see both successes and failures.
- Use predictive tools with accountability. Deploy machine‑learning triage systems like the ones students built only with continuous fairness auditing, robust human oversight, and clear rules to prioritize the highest‑risk children, not to ration services.
Most importantly, the policy conversation has to shift. Poverty reduction, housing support, substance abuse treatment, and childcare subsidies are not just “social programs” — the evidence now shows they are child protection strategies.
The real projection
If current structural conditions remain unchanged — poverty, unstable housing, substance use, uneven prevention infrastructure, and opaque reporting — the most honest projection is this: official numbers will continue to understate the true harm to children, and the youngest and poorest will remain at the greatest risk.
But if states pair structural investments with honest, transparent data practices — limiting overuse of Family Assessment, standardizing fatality reporting, and fully using the predictive power of administrative data with strong safeguards — the next decade could look very different.
The student teams working with KARA have shown that child welfare risk is not random and not unknowable. The remaining question is whether systems will use that knowledge to find and protect vulnerable children — or to continue undercounting them.
WHEN YOU Share KARA’s reporting with FRIENDS, INSTAGRAM & FACEBOOK
CALL AND EMAIL YOUR STATE REPRESENTATIVE AND
SHARE THIS POST AND YOUR CONCERNS
at-risk children and your community will benefit:
Small efforts = real results.
KARA / KIDS AT RISK ACTION / INVISIBLE CHILDREN
For a deeper dive into student research click here